import psutil
import time
import curses
from pynvml import *
def get_top_cpu_processes():
    processes = psutil.process_iter(['pid', 'name', 'cpu_percent'])
    top_processes = sorted(processes, key=lambda p: p.info['cpu_percent'], reverse=True)[:15]
    return top_processes
def get_system_stats():
cpu_usage = psutil.cpu_percent(interval=1)
cpu_core_usages = psutil.cpu_percent(interval=1, percpu=True)
memory_info = psutil.virtual_memory()
memory_usage = memory_info.percent
cpu_freq = psutil.cpu_freq()
return cpu_usage, cpu_core_usages, memory_usage, cpu_freq
def get_gpu_stats():
nvmlInit()
device_count = nvmlDeviceGetCount()
gpu_stats = []
for i in range(device_count):
handle = nvmlDeviceGetHandleByIndex(i)
gpu_name = nvmlDeviceGetName(handle)
gpu_memory = nvmlDeviceGetMemoryInfo(handle)
gpu_utilization = nvmlDeviceGetUtilizationRates(handle)
gpu_temp = nvmlDeviceGetTemperature(handle, NVML_TEMPERATURE_GPU)
gpu_stats.append({
'name': gpu_name,
'memory_used': gpu_memory.used / 1024**3,
'memory_total': gpu_memory.total / 1024**3,
'utilization': gpu_utilization.gpu,
'temperature': gpu_temp
})
nvmlShutdown()
return gpu_stats
def draw_bar(stdscr, y, width, percent, color_pair, color_inv):
bar_length = int(width * (percent / 100))
bar = ' ' * bar_length
stdscr.addstr(y, 0, bar, curses.color_pair(color_pair) | curses.A_BOLD)
stdscr.addstr(y, bar_length, '|' * (width - bar_length), curses.color_pair(6))
stdscr.addstr(y, width, '|', curses.color_pair(color_inv))
def draw_rect(stdscr, y: int, x: int, width: int, max_width: int, color_pair, color_inv):
bar = ' '*width
stdscr.addstr(y, x, bar, curses.color_pair(color_pair) | curses.A_BOLD)
stdscr.addstr(y, width+x, '|' * (max_width - width), curses.color_pair(6))
stdscr.addstr(y, max_width+x, '|', curses.color_pair(color_inv))
def display_stats(stdscr):
curses.curs_set(0)
stdscr.nodelay(1)
curses.start_color()
curses.init_pair(1, curses.COLOR_WHITE, curses.COLOR_BLACK)
curses.init_pair(2, curses.COLOR_RED, curses.COLOR_BLACK)
curses.init_pair(3, curses.COLOR_WHITE, curses.COLOR_BLACK)
curses.init_pair(4, curses.COLOR_GREEN, curses.COLOR_BLACK)
curses.init_pair(5, curses.COLOR_BLACK, curses.COLOR_WHITE)
curses.init_pair(6, curses.COLOR_BLACK, curses.COLOR_BLACK)
curses.init_pair(7, curses.COLOR_BLACK, curses.COLOR_YELLOW)
curses.init_pair(8, curses.COLOR_BLACK, curses.COLOR_GREEN)
curses.init_pair(9, curses.COLOR_YELLOW, curses.COLOR_BLACK)
curses.init_pair(10, curses.COLOR_GREEN, curses.COLOR_BLACK)
curses.init_pair(11, curses.COLOR_BLACK, curses.COLOR_CYAN)
curses.init_pair(12, curses.COLOR_CYAN, curses.COLOR_BLACK)
bold = curses.A_BOLD
while True:
height, width = stdscr.getmaxyx()
max_width = width-10
cpu_usage, cpu_core_usages, memory_usage, cpu_freq = get_system_stats()
gpu_stats = get_gpu_stats()
stdscr.clear()
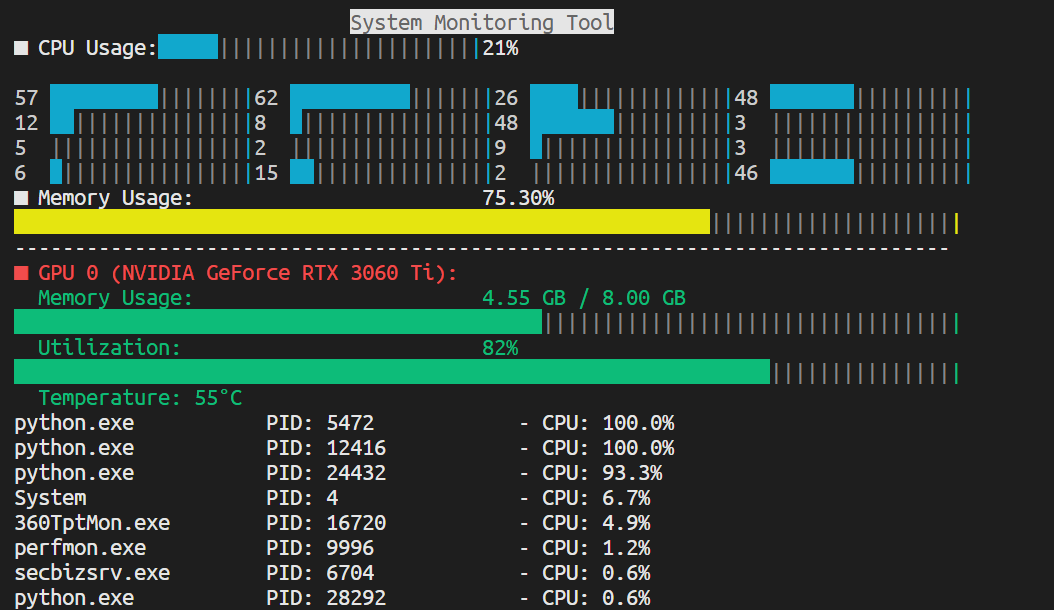
stdscr.addstr(0, int((max_width-22)/2), "System Monitoring Tool", curses.color_pair(5) | bold)
stdscr.addstr(1, 0, "■ CPU Usage:", curses.color_pair(1) | bold)
stdscr.addstr(1, int(max_width/2), "%d"%cpu_usage + "%", curses.color_pair(1) | bold)
draw_rect(stdscr, 1, 12, int((int(max_width/2)-13)*cpu_usage/100), int(int(max_width/2)-13), 11, 12)
line = 3
id = 0
while id < len(cpu_core_usages):
stdscr.addstr(line, 0, f"{cpu_core_usages[id]:.0f}", curses.color_pair(1))
draw_rect(stdscr, line, 3, int((max_width-12)/4*cpu_core_usages[id]/100), int((max_width-12)/4), 11, 12)
id+=1
stdscr.addstr(line, int((max_width-12)/4)+4, f"{cpu_core_usages[id]:.0f}", curses.color_pair(1))
draw_rect(stdscr, line, int((max_width-12)/4)+7, int((max_width-12)/4*cpu_core_usages[id]/100), int((max_width-12)/4), 11, 12)
id+=1
stdscr.addstr(line, int((max_width-12)/4)*2+8, f"{cpu_core_usages[id]:.0f}", curses.color_pair(1))
draw_rect(stdscr, line, int((max_width-12)/4)*2+11, int((max_width-12)/4*cpu_core_usages[id]/100), int((max_width-12)/4), 11, 12)
id+=1
stdscr.addstr(line, int((max_width-12)/4)*3+12, f"{cpu_core_usages[id]:.0f}", curses.color_pair(1))
draw_rect(stdscr, line, int((max_width-12)/4)*3+15, int((max_width-12)/4*cpu_core_usages[id]/100), int((max_width-12)/4), 11, 12)
id+=1
line+=1
stdscr.addstr(line, 0, "■ Memory Usage:", curses.color_pair(3) | bold)
stdscr.addstr(line, int(max_width/2), f"{memory_usage:.2f}%", curses.color_pair(3) | bold)
line+=1
draw_bar(stdscr, line, max_width, memory_usage, 7, 9)
line+=1
stdscr.addstr(line, 0, "-"*(max_width), curses.color_pair(1) | bold)
line+=1
for i, gpu in enumerate(gpu_stats):
stdscr.addstr(line, 0, f"■ GPU {i} ({gpu['name']}):", curses.color_pair(2) | bold)
stdscr.addstr(line + 1, 0, " Memory Usage:", curses.color_pair(4))
stdscr.addstr(line + 1, int(max_width/2), f"{gpu['memory_used']:.2f} GB / {gpu['memory_total']:.2f} GB", curses.color_pair(4))
draw_bar(stdscr, line + 2, max_width, (gpu['memory_used'] / gpu['memory_total']) * 100, 8, 10)
stdscr.addstr(line + 3, 0, " Utilization:", curses.color_pair(4))
stdscr.addstr(line + 3, int(max_width/2), f"{gpu['utilization']}%", curses.color_pair(4))
draw_bar(stdscr, line + 4, max_width, gpu['utilization'], 8, 10)
stdscr.addstr(line + 5, 0, f" Temperature: {gpu['temperature']}°C", curses.color_pair(4))
line += 7
top_processes = get_top_cpu_processes()
top_processes = top_processes[1:]
line -=1
max_name_length = max(max(len(p.info['name']) for p in top_processes), 20)
max_pid_length = len(str(max(p.info['pid'] for p in top_processes)))+10
for i, process in enumerate(top_processes):
if line >= height:
break
process_info = f"{process.info['name'].ljust(max_name_length)} PID: {process.info['pid']:<{max_pid_length}} - CPU: {process.info['cpu_percent']}%"
if line < height:
stdscr.addstr(line, 0, process_info, curses.color_pair(1) | bold)
line += 1
stdscr.refresh()
time.sleep(0.5)
if stdscr.getch() == ord('q'):
break
if __name__ == "__main__":
curses.wrapper(display_stats)
|